Curve Best Yields & Key Metrics | Week 3, 2025
Weekly yield and Curve ecosystem metric updates as of the 17rd January, 2025
Market Overview
Curve's ecosystem is showing strong momentum this week. With TVL climbing modestly to $2.465B, and the scrvUSD system proving its effectiveness, and working as designed.
Growing scrvUSD demand pushed crvUSD above $1, which triggered PegKeepers to start selling crvUSD and accumulate debt, and drove borrowing rates to decrease to near 0%.
The next phase followed naturally - borrowing activity increased, the crvUSD circulating supply expanded, bringing crvUSD just below its $1 peg. Rates have since settled at 4% annually, and PegKeepers have shifted to rebuying their sold crvUSD, which generates profits for CurveDAO.
At a weekly average of 3.6%, crvUSD minting rates remain the lowest stablecoin borrowing rate among major lending platforms, and create attractive yield spreads for traders using the crvUSD ecosystem.
While it's a great time to borrow on Curve, there are also some great opportunities for yield within the Curve ecosystem, which are detailed below.
Top Yields
Top Performing Pools by Asset Class
| Chain | Pool | Type | Yield |
|---|---|---|---|
 |
 CRV CRV crvUSD crvUSD |
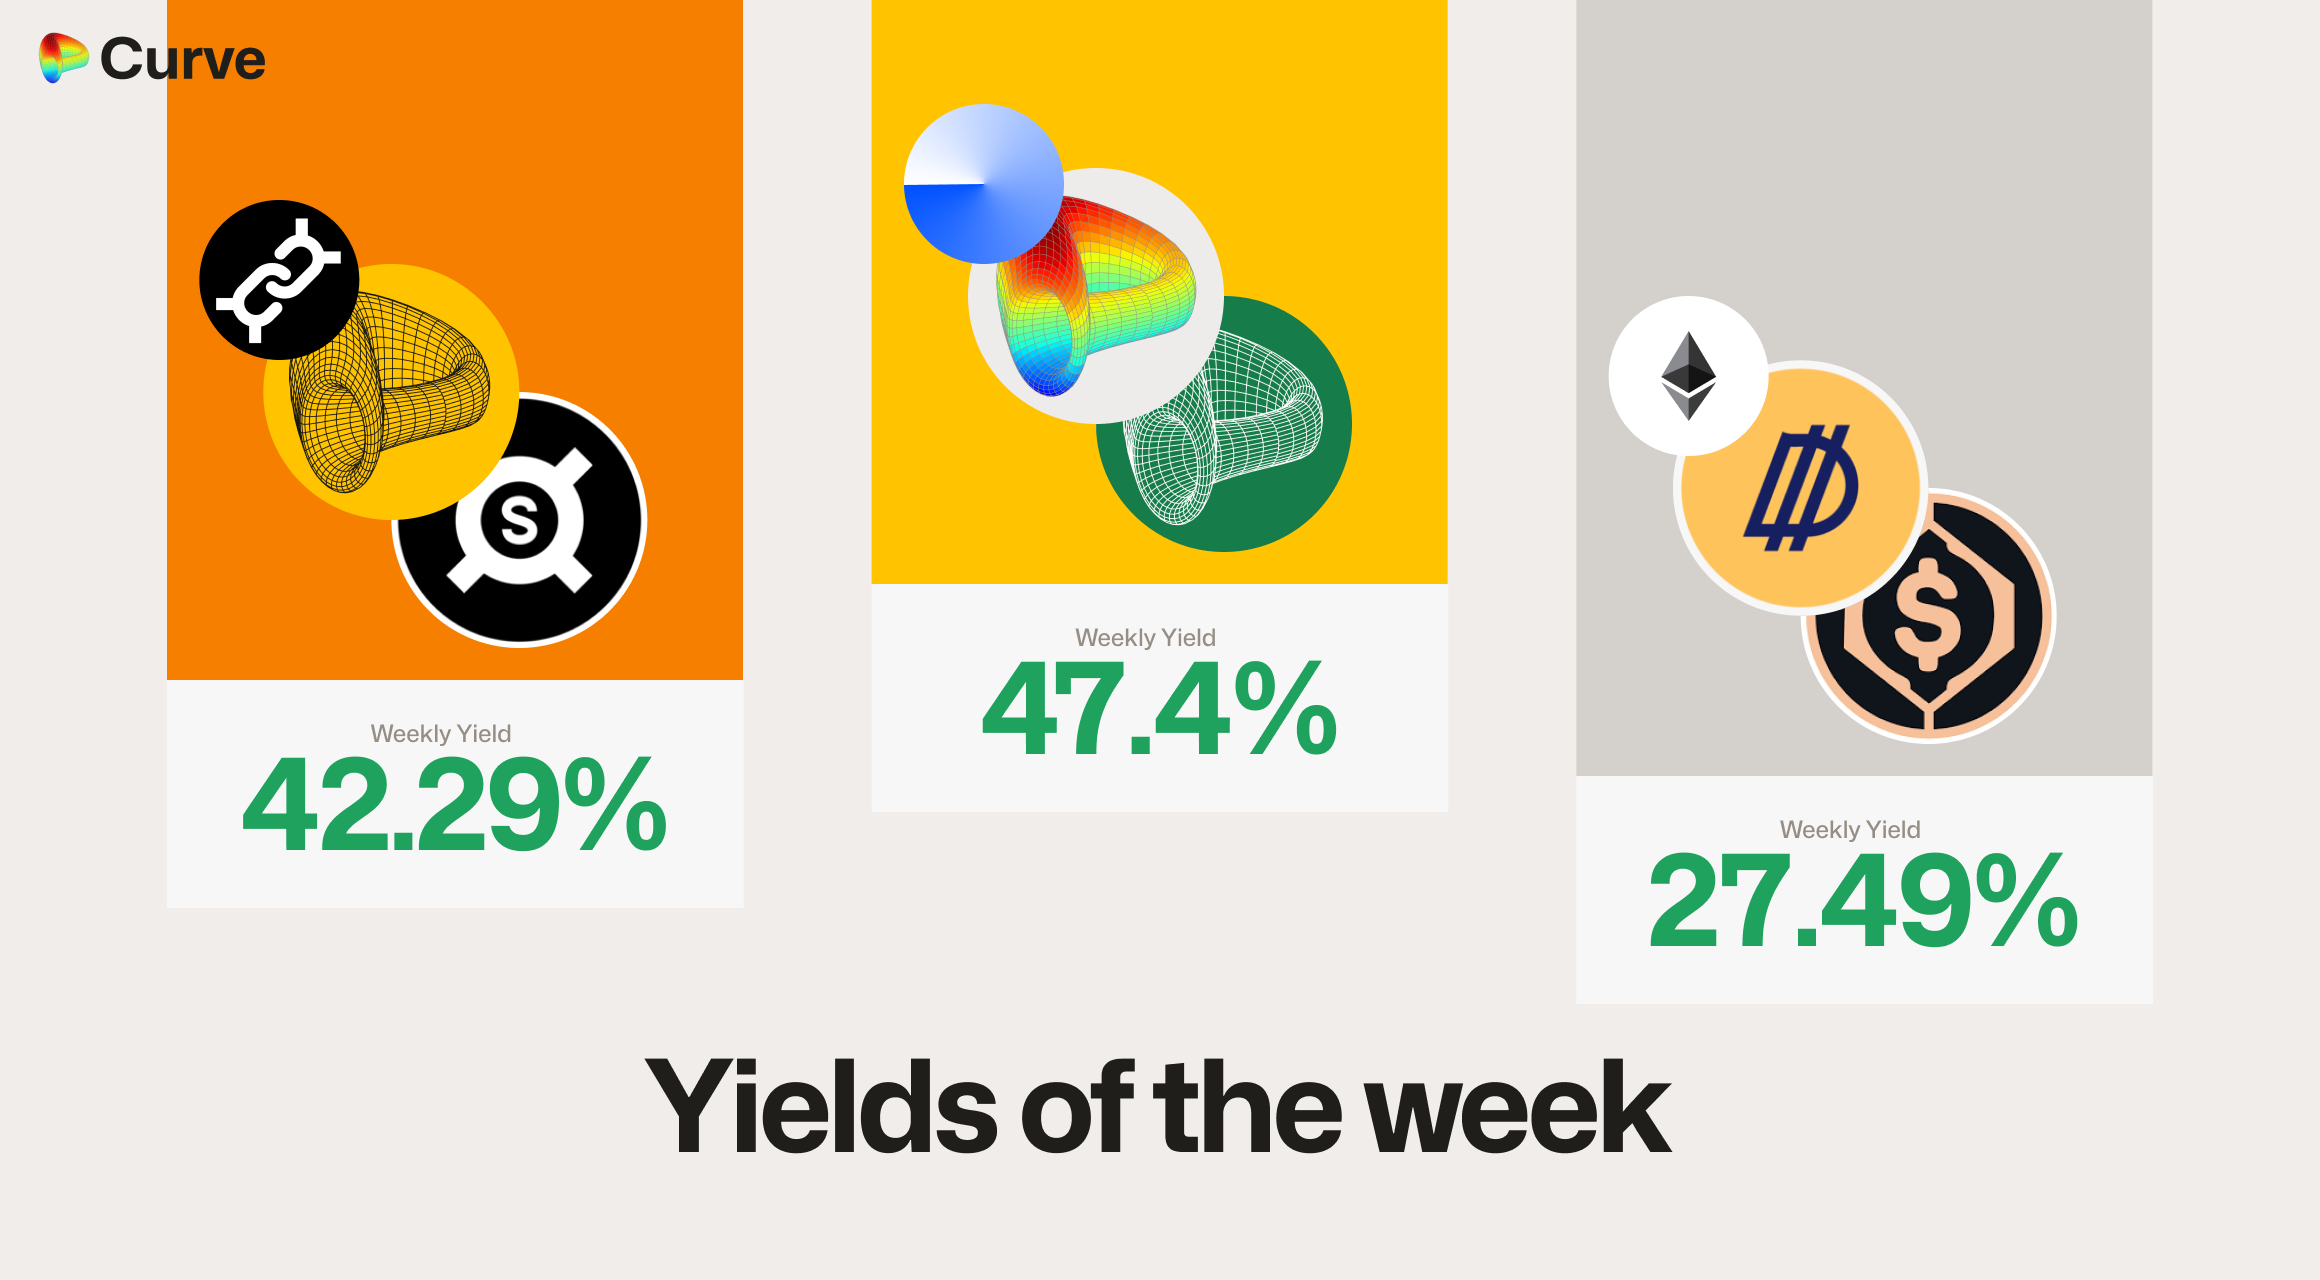
CRV | 47.4% |
 |
 scrvUSD scrvUSD sFRAX sFRAX |
USD | 42.29% |
 |
 sDOLA sDOLA alUSD alUSD |
USD | 27.49% |
 |
 eUSD eUSD USDC USDC |
USD | 27.14% |
 |
 zunBTC zunBTC tBTC tBTC |
BTC | 26.89% |
 |
 CRV CRV vsdCRV vsdCRV asdCRV asdCRV |
CRV | 26.46% |
 |
 zunETH zunETH WETH WETH |
ETH | 17.84% |
 |
 EURA EURA EURT EURT EURS EURS |
EUR | 17.42% |
 |
 alETH alETH WETH WETH |
ETH | 10.72% |
 |
 tBTC tBTC cbBTC cbBTC |
BTC | 5.79% |
crvUSD & scrvUSD Yield Opportunities
| Chain | Market | Type | Yield |
|---|---|---|---|
 |
 scrvUSD scrvUSD sFRAX sFRAX |
Pool | 42.29% |
 |
 crvUSD crvUSD ARB ARB |
LlamaLend | 25% |
 |
 crvUSD crvUSD ynETH ynETH |
LlamaLend | 24.43% |
 |
 crvUSD crvUSD WBTC WBTC |
LlamaLend | 23.54% |
 |
 crvUSD crvUSD WETH WETH |
LlamaLend | 22.11% |
 |
 sUSD sUSD crvUSD crvUSD |
Pool | 20.73% |
Ecosystem Metrics
All changes (shown with + or -) represent the difference compared to values from one week ago.
CrvUSD & scrvUSD Performance
This week was the first week that crvUSD has been above peg since the scrvUSD system was introduced, which validates the system as working, as this is what it was designed to do.
| Metric | Value | Change |
|---|---|---|
 crvUSD Circ. Supply crvUSD Circ. Supply |
$83.34M | +8.39% |
 scrvUSD Yield scrvUSD Yield |
6.67% APY | -6.13% |
 crvUSD in crvUSD in scrvUSD scrvUSD |
35.46% | +1.98% |
 crvUSD Peg crvUSD Peg |
$0.9998 | +$0.0003 |
CrvUSD Loan Metrics
CrvUSD borrow rates fell sharply from 12% to 3.6% annually as demand for scrvUSD yield pushed crvUSD above its peg. This rate drop attracted new borrowers and drove an 8% expansion in crvUSD's circulating supply this week.
| Metric | Value | Change |
|---|---|---|
| Avg. Borrow Rate | 3.651% | -8.53% |
| crvUSD Borrowed | $83.34M | +8.39% |
| Collateral | $163.7M | +18.12% |
| Loans | 687 | +44 |
| Fees | $75.8k | -63.85% |
| Pegkeeper Debt | $7.614M | +$5.393M |
Pool Statistics
Usual's USD0++ peg fluctuations drove higher trading activity this week. This surge in transactions and fees boosted revenue for locked CRV holders compared to last week's levels.
| Metric | Value | Change |
|---|---|---|
| TVL | $2.266B | +1.21% |
| Volume | $3.635B | +34.67% |
| Transactions | 357,923 | +14.23% |
| Total Fees | $970.2k | +23.85% |
| DAO Fees | $485.1k | +23.85% |
LlamaLend Performance
Low crvUSD borrowing rates triggered a chain reaction: Llamalend markets rates decreased, which increased borrowing activity. Users capitalized on this by borrowing from crvUSD minting markets and supplying to Llamalend markets, capturing attractive yield spreads.
| Metric | Value | Change |
|---|---|---|
| Lending TVL | $46.83M | +12.25% |
| Supplied | $35.4M | +10.85% |
| Borrowed | $23.7M | +6.19% |
| Collateral | $35.13M | +9.39% |
| Loans | 664 | - |
Notable Pool Activity
It's no surprise to see Usual's USD0 and USD0++ pools led Curve's metrics for both trading volume and fee generation this week. The increased market volatility, combined with dynamic fees from Curve's Stableswap pools, delivered strong returns for liquidity providers.
Highest Volume Pools
| Chain | Pool | Volume | TVL |
|---|---|---|---|
 |
 USD0 USD0 USDC USDC |
$887.8M | $74.56M |
 |
 DAI DAI USDC USDC USDT USDT |
$622.8M | $161M |
 |
 USD0 USD0 USD0++ USD0++ |
$577M | $229.1M |
 |
 USDe USDe USDC USDC |
$201.9M | $12.7M |
Highest Fee Generating Pools
| Chain | Pool | Fees | Volume |
|---|---|---|---|
 |
 USD0 USD0 USD0++ USD0++ |
$230.7k | $577M |
 |
 USD0 USD0 USDC USDC |
$177.6k | $887.8M |
 |
 DAI DAI USDC USDC USDT USDT |
$62.27k | $622.8M |
 |
 USR USR USDC USDC |
$60.77k | $152M |
Most Profitable Pools
As always Stableswap pools dominate volume and fees, but Cryptoswap pools with non-pegged assets are the most profitable for LPs.
Note: Minimum $100k TVL, profitability is measured by fees per $1 of liquidity
| Chain | Pool | Fees | TVL |
|---|---|---|---|
 |
 crvUSD crvUSD WETH WETH CRV CRV |
$30.1k | $8.188M |
 |
 WETH WETH CVX CVX |
$42.77k | $12.74M |
 |
 crvUSD crvUSD WBTC WBTC WETH WETH |
$7.502k | $2.399M |
Curve's ecosystem continues to expand rapidly, welcoming new teams and pools weekly. If you're interested in launching a pool, lending market, or simply want to connect with the community, join us on Telegram or Discord.
Risk Disclaimer
Risk Advisory: References to specific pools or Llamalend markets do not constitute endorsements of their safety. We strongly encourage conducting personal risk analysis before engaging with any pools or markets. Please review our detailed risk disclaimers: Pool Risk Disclaimer, Llamalend Risk Disclaimer, crvUSD Risk Disclaimer.
